
What is Cloudvisor’s Monitoring Service?
When you subscribe to Cloudvisor’s Monitoring Services, you ensure your AWS infrastructure complies with AWS Best Practices, is highly available, and runs smoothly. You have access to a custom-made monitoring and alerting platform, built on top of AWS Managed Grafana, where you can connect different data sources like Prometheus, AWS Container Insights, and AWS CloudWatch Metrics and seamlessly create multiple types of dashboards.
Besides the dashboards, our Cloud and DevOps professionals can set up an alarm baseline so that you are immediately notified and can take action when a breach happens. This is a perfect solution for our customers because it saves time from configuring, managing, and monitoring the infrastructure, all while knowing you have experts ready to help you.
Use case: CloudWatch + Monitoring Service
This article will explore a more specific use of our Monitoring Solution: Getting the computer-related metric-specific questions, unavailable by default, integrating CloudWatch Agent and our Monitoring Services.
A common scenario we encounter from our customers is the need to scrape non-base metrics like Memory Utilization and Disk Usage from EC2 instances. There are multiple ways to do it: open source tools, tools by 3rd party service providers, and even AWS has its own process to get the required metrics from EC2 instances. But from experience, we recommend using AWS CloudWatch Agent, a tool developed and maintained by the AWS CloudWatch team.
AWS CloudWatch is a managed service; you don’t need to think about provisioning any resources. One of the most significant advantages of AWS CloudWatch is that it provides basic metrics of the infrastructure layer for free. If you have an AWS RDS Database, you will have more than enough metrics to analyze the database performance for free; if you have an EC2 instance, you will also have base metrics regarding CPU, data transfer, IOPS, etc., for free.
Setting the AWS CloudWatch Agent
Using AWS CloudWatch Agent allows you to collect custom metrics from EC2 instances and system-level metrics of servers from on-premises. Also, with changes regarding collecting logs, AWS united the log agent and the metric agent, so AWS CloudWatch (unified) agent also has the capability to scrape logs from machines and send them to AWS CloudWatch Logs.
Installing AWS CloudWatch Agent
We will use Amazon Linux 2 AMI for the EC2 instances for demonstration purposes.
- Installing the AWS CloudWatch Agent is a straightforward process from the shell, using simple commands.
sudo yum install amazon-cloudwatch-agent- After installing the agent, we can verify if it works by issuing the following command.
amazon-cloudwatch-agent-ctl- The result will be all the available options that we can further issue using this utility tool.
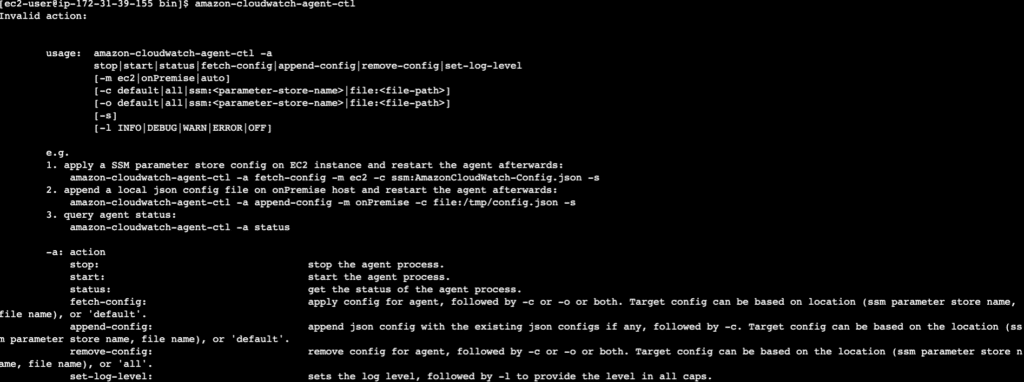
Configuring EC2 Instance’s Instance Profile
An EC2 Instance can acquire short-lived credentials using the Instance IAM Instance Profile (IAM Role). Regarding IAM Policy, use the suggested and AWS-managed CloudWatchAgentServerPolicy in the Instance Profile to send metrics to AWS CloudWatch. Described here.
Configuring the AWS CloudWatch Agent config file
After the AWS CloudWatch Agent has been installed, by producing the config file, there are two ways to configure the agent.
- The first option to produce the config file is by the use of the agent wizard, which is a straightforward process with a couple of customization steps that you can choose; for example, if the agent is installed on an EC2 or On-Prem server, would it require Basic/Standard/Advanced level metrics. More about this here.
To issue the AWS CloudWatch Agent Wizard, type the following command:
sudo /opt/aws/amazon-cloudwatch-agent/bin/amazon-cloudwatch-agent-config-wizardThis command would prompt the questions to answer.
- The next option to configure the AWS CloudWatch agent is to create the config file in a
jsonextension. The following snippet gives you an example of how to monitor Memory Usage and EBS Root Volume disk usage.
# /opt/aws/amazon-cloudwatch-agent/bin/config.json

{
        "agent": {
                "metrics_collection_interval": 60,
                "run_as_user": "root"
        },
        "metrics": {
                "aggregation_dimensions": [
                        [
                                "InstanceId"
                        ]
                ],
                "append_dimensions": {
                        "AutoScalingGroupName": "${aws:AutoScalingGroupName}",
                        "ImageId": "${aws:ImageId}",
                        "InstanceId": "${aws:InstanceId}",
                        "InstanceType": "${aws:InstanceType}"
                },
                "metrics_collected": {
                        "disk": {
                                "measurement": [
                                        "used_percent"
                                ],
                                "metrics_collection_interval": 60,
                                "resources": [
                                        "/"
                                ]
                        },
                        "mem": {
                                "measurement": [
                                        "mem_used_percent"
                                ],
                                "metrics_collection_interval": 60
                        }
                }
        }
}
The configuration file above is helping to achieve the followings:
- As you can see in the
agentsection, themetrics_collection_intervalInterval is defined; it will give a default interval in seconds to all the collected metrics defined in the file. This value can be overwritten by the othermetrics_collection_intervalvalues defined above the file. - The config file collects the Root Volume disk usage metrics measured in percentages. It also collects the percentage of the System’s Memory.
- Additional dimensions would have been added to the metrics. As you can see, the AutoScalingGrupName, ImageId, InstanceId, and InstanceType (if any are available) will create a new dimension for the metric data point.
You can find the different configuration options here.
Starting the AWS CloudWatch Agent
Starting the agent is as simple as using the amazon-cloudwatch-agent-ctl CLI tool. After we have our configuration files, we can issue the following command in the EC2 terminal.
sudo /opt/aws/amazon-cloudwatch-agent/bin/amazon-cloudwatch-agent-ctl -a fetch-config -m ec2 -c file:/opt/aws/amazon-cloudwatch-agent/bin/config.json -sIt would load the configuration and would start sending metrics to CloudWatch.
Looking at the results
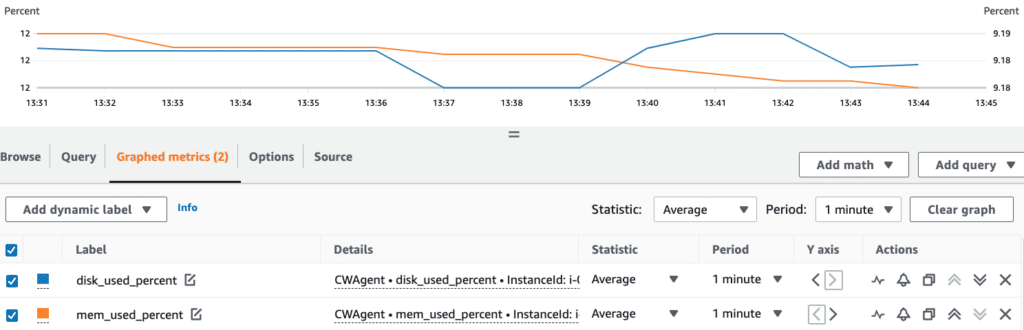
After waiting a few minutes for the AWS CloudWatch Agent to send the metrics to AWS CloudWatch, we can navigate to the Metrics page and see the result. We can see that a new custom metric group has been created. There has been a new namespace created called CWAgent. Inside the CWAgent namespace new; you can see a new aggregation option based on InstanceId. Inside the InstanceId aggregation, you will see the disk_used_percent and the mem_used_percent metrics as below.

Monitoring a Custom Process
To monitor custom processes by the AWS CloudWatch Agent and send them to AWS CloudWatch, we need to extend the configuration file with a couple of lines according to the modification below as we monitor the nginx and the postgres process.
We need to extend the AWS CloudWatch Agent configuration file.
# /opt/aws/amazon-cloudwatch-agent/bin/config.json

{
        "agent": {
                "metrics_collection_interval": 60,
                "run_as_user": "root"
        },
        "metrics": {
                "aggregation_dimensions": [
                        [
                                "InstanceId"
                        ]
                ],
                "append_dimensions": {
                        "AutoScalingGroupName": "${aws:AutoScalingGroupName}",
                        "ImageId": "${aws:ImageId}",
                        "InstanceId": "${aws:InstanceId}",
                        "InstanceType": "${aws:InstanceType}"
                },
                "metrics_collected": {
                        "disk": {
                                "measurement": [
                                        "used_percent"
                                ],
                                "metrics_collection_interval": 60,
                                "resources": [
                                        "/"
                                ]
                        },
                        "mem": {
                                "measurement": [
                                        "mem_used_percent"
                                ],
                                "metrics_collection_interval": 60
                        },
                        "procstat": [ # NEED TO EXTEND WITH procstat
                                {
                                        "exe": "nginx", # exe - process to collect metrics on
                                        "measurement": [
                                                "cpu_usage",
                                                "memory_rss"
                                        ]
                                },
                                {
                                        "exe": "postgres",
                                        "measurement": [
                                                "cpu_usage",
                                                "memory_rss"
                                        ]
                                }
                        ]
                }

        }
}
After each configuration change, we must fetch the new config with the AWS CloudWatch Agent. So run the sudo /opt/aws/amazon-cloudwatch-agent/bin/amazon-cloudwatch-agent-ctl -a fetch-config -m ec2 -c file:/opt/aws/amazon-cloudwatch-agent/bin/config.json -s command.
Navigating to the AWS CloudWatch Metrics dashboard, we can identify the new metrics and take a look at them. We can see that both the nginx process and postgres process have two new metrics collected by AWS CloudWatch. See the image below.
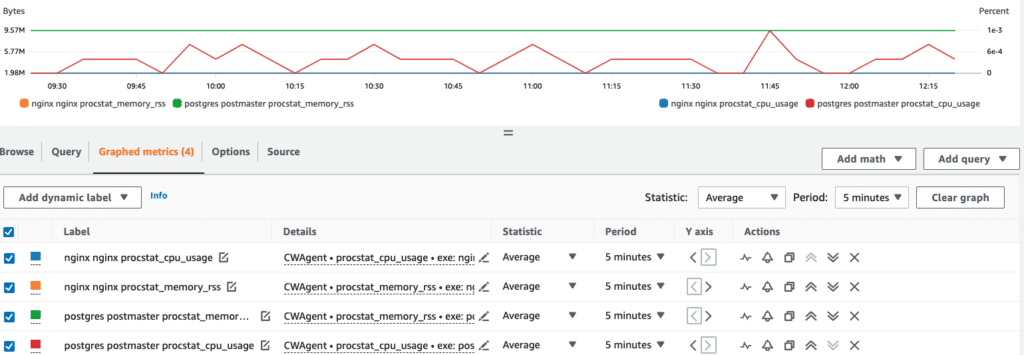
The official AWS Documentation on how to use the procstat plugin can be found here.
Using Cloudvisor Monitoring Service
Let’s visit the Cloudvisor Monitoring Solution. When we, as Cloudvisor, configure the solution for our customers, we listen to their needs and have clear requirements to start the process. We connect the data sources and configure alerts and dashboards.
After configuring the metrics on AWS CloudWatch Agent, as seen in the previous section, we can now represent an EC2 instance base metrics in a simple dashboard with RAM and Disk Usage metrics combined with CPU Utilization (base metric).
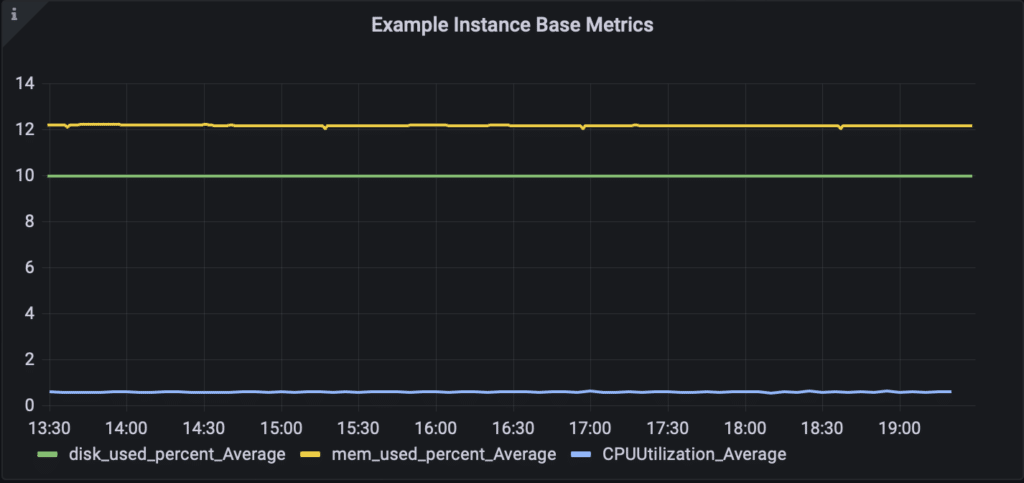
Also, we added the custom processes related to NGINX and PostgreSQL to the AWS CloudWatch Agent and can include them in the dashboard.
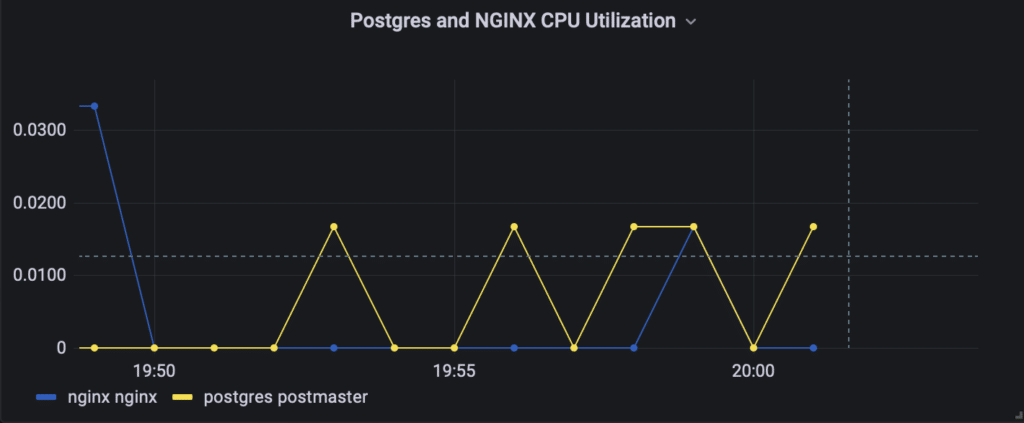
Now the user has a custom-made dashboard that can help to get insights into their RAM, Disk Usage, and custom process metrics. A user-friendly solution that, combined with the alerting system set by our engineers, ensures that problems aren’t missed and can be responded to agilely.
Summary
The user guide showcases how to install and configure the AWS CloudWatch Agent to send different types of metrics (RAM and Disk Usage and custom process) to AWS CloudWatch and get a user-friendly representation in the Cloudvisor Monitoring Solution.
AWS CloudWatch Agent has the ability to define the aggregation, define the interval and determine what to collect. It has default built-in functions which need to be enabled, like RAM and Disk usage metrics. Also, we can define all kinds of processes to monitor using the procstat plugin.
The guide focused on a typical use case where our customer needed to answer compute-related metrics questions quickly, with information unavailable by default. We used an AWS CloudWatch Agent integration and the use of Cloudvisor Monitoring Solution to monitor containerized workflows in ECS and Kubernetes Clusters, building future-rich dashboards focusing on critical aspects of the infrastructure and setting up alerts and notifications.
Get Started with Cloudvisor Monitoring Service!
Cloudvisor’s Monitoring Service is a must-have for your cloud infrastructure!
Say goodbye to spending weeks configuring and managing your monitoring infrastructure! You get access to a team of cloud and DevOps experts ready to help; now, you can sleep soundly, knowing that your AWS infrastructure is highly available and running smoothly.

Written by Sándor Bakos
AWS Cloud Engineer/Architect at Cloudvisor