Harnessing the Power of Amazon CloudWatch for Seamless Operations and Improved Performance


AWS partner dedicated to startups
- 2000+ Clients
- 5+ Years of Experience
- $10M+ saved on AWS
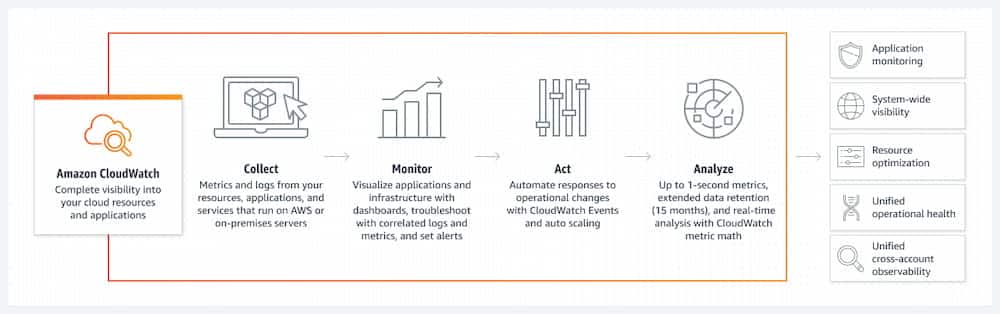
In today’s digital landscape, businesses are constantly seeking ways to streamline their operations and enhance performance. One tool that has proven to be instrumental in achieving these goals is Amazon CloudWatch. With its comprehensive monitoring and management capabilities, CloudWatch offers businesses the ability to effortlessly monitor their AWS resources and applications in real-time.
Whether you need to keep an eye on your infrastructure’s health, track specific performance metrics, or gain valuable insights into system-level events, CloudWatch has got you covered. Its robust set of monitoring features enables businesses to proactively detect and resolve issues, ensuring seamless operations and improved performance.
Table of Contents
By harnessing the power of CloudWatch, businesses can gain full visibility into their AWS environment, allowing them to optimize their resource utilization and identify potential bottlenecks. With its intuitive dashboard, customizable alarms, and rich analytics, CloudWatch empowers businesses to make data-driven decisions, ultimately driving efficiency and reducing costs.
In this guide, we will explore the various features and capabilities of Amazon CloudWatch, and delve into how businesses can leverage this powerful tool to achieve operational excellence and drive success. So, let’s dive in and discover the wonders of CloudWatch!
Benefits of using Amazon CloudWatch
Amazon CloudWatch provides a multitude of benefits for businesses looking to optimize their AWS environment.
- CloudWatch offers full visibility into your resources, allowing you to monitor and track the health and performance of your infrastructure in real-time. This enables you to identify and resolve issues before they impact your operations, ensuring that your systems are always running smoothly.
- CloudWatch provides detailed insights and analytics, allowing you to gain a deeper understanding of your system’s behaviour and performance. By analyzing performance metrics and logs, you can identify potential bottlenecks and optimize your resource utilization, ultimately improving the overall efficiency of your operations.
- CloudWatch offers customizable alarms that can be set up to notify you of any abnormal behaviour or threshold breaches. This proactive monitoring approach enables you to take immediate action, minimizing downtime and ensuring uninterrupted service for your customers.
Key features of Amazon CloudWatch
Amazon CloudWatch offers a wide range of features that empower businesses to monitor and manage their AWS environment effectively. Some of the key features include:
Metrics and Dashboards
CloudWatch allows you to collect, monitor, and visualize metrics in real-time through customizable dashboards. This enables you to gain a holistic view of your system’s performance and quickly identify any anomalies or trends.
Alarms
With CloudWatch alarms, you can set up customized thresholds and receive notifications via email or SMS when these thresholds are breached. This proactive monitoring approach ensures that you are always aware of any issues and can take immediate action to resolve them.
Logs
CloudWatch Logs enables you to centralize and analyze your log data from various AWS services and applications. By consolidating your logs in one place, you can easily troubleshoot issues, identify patterns, and gain valuable insights into your system’s behaviour.
Insights
CloudWatch Insights allows you to analyze and query your log data using a powerful query language. This enables you to extract specific information and gain actionable insights quickly, reducing the time and effort required for troubleshooting.
Events
CloudWatch Events enables you to automate actions in response to specific events or triggers. This allows you to streamline your operations and improve efficiency by automating routine tasks and reducing manual intervention.
Setting up Amazon CloudWatch
Getting started with Amazon CloudWatch is a straightforward process. To begin, you need an AWS account, and you can access CloudWatch through the AWS Management Console, AWS CLI, or AWS SDKs.
Once you’re logged in, you can navigate to the CloudWatch service and start creating your monitoring setup. CloudWatch provides a user-friendly interface that allows you to configure various settings, such as selecting the resources you want to monitor, defining custom metrics, and setting up alarms.
To monitor your resources, you can either use the default metrics provided by AWS services or create custom metrics based on your specific requirements. CloudWatch supports a wide range of AWS services, including EC2, RDS, S3, Lambda, and more, allowing you to monitor various aspects of your infrastructure.
Monitoring Resources with Amazon CloudWatch
Amazon CloudWatch offers comprehensive monitoring capabilities for your AWS resources. By default, CloudWatch automatically collects and stores metrics for many AWS services. These metrics provide valuable insights into the health, performance, and utilization of your resources.
To monitor your resources effectively, you can create customized dashboards that display the metrics most relevant to your business. These dashboards can be easily customized to show different graphs, charts, and statistics, providing a clear and concise overview of your system’s performance.
In addition to monitoring individual resources, CloudWatch also allows you to aggregate metrics across multiple resources using metric math and advanced statistics. This enables you to gain a holistic view of your system’s behaviour and identify any patterns or trends that may impact performance.
Creating and Managing CloudWatch Alarms
CloudWatch alarms play a crucial role in proactive monitoring and issue resolution. With alarms, you can set up customized thresholds for your metrics and receive notifications when these thresholds are breached.
To create an alarm, you simply need to select the metric you want to monitor, define the threshold values, and specify the actions to be taken when the threshold is breached. These actions can include sending notifications via email or SMS, triggering automated actions using CloudWatch Events, or even integrating with other AWS services.
Once an alarm is triggered, CloudWatch provides detailed insights and actionable data to help you investigate and resolve the issue. You can view historical data, analyze logs, and gain a deeper understanding of the events leading up to the alarm.
Managing CloudWatch alarms is a straightforward process. You can easily modify the alarm settings, such as the threshold values, actions, or even the duration before an alarm is triggered. This flexibility allows you to fine-tune your monitoring setup and ensure that you are always alerted to critical issues.
Using CloudWatch Logs for Centralized Log Management
CloudWatch Logs offers a centralized and scalable solution for managing logs from various AWS services and applications. By consolidating your logs in one place, you can easily search, analyze, and gain insights into your log data.
To get started with CloudWatch Logs, you need to configure log streams and log groups. Log streams represent the source of your log data, such as an EC2 instance or an application running on AWS. Log groups, on the other hand, act as containers for your log streams, allowing you to organize and manage your logs effectively.
Once your log streams and log groups are set up, CloudWatch Logs provides a powerful query language that enables you to search and analyze your log data. You can filter logs based on specific criteria, extract useful information, and gain valuable insights into your system’s behaviour.
CloudWatch Logs also offers integration with other AWS services, such as AWS Lambda and AWS Glue, allowing you to automate log analysis and further enhance your operational efficiency.
Analyzing Performance Metrics with CloudWatch Insights
CloudWatch Insights is a powerful feature that allows you to analyze and query your log data using a simple and intuitive query language. With Insights, you can extract specific information from your log data and gain actionable insights quickly.
To analyze your log data with CloudWatch Insights, you need to specify the log groups and log streams you want to query. Once your query is executed, CloudWatch Insights provides the results in a structured format, allowing you to easily identify patterns, trends, and anomalies.
CloudWatch Insights supports a wide range of functions and operators, enabling you to perform complex queries and calculations. You can filter logs based on specific criteria, aggregate metrics, perform calculations, and visualize the results using charts and tables.
By leveraging the power of CloudWatch Insights, you can save time and effort in analyzing log data, allowing you to focus on resolving issues and improving your system’s performance.
Automating Actions with CloudWatch Events
CloudWatch Events enables you to automate actions in response to specific events or triggers. By defining rules, you can specify the conditions that need to be met for an action to be triggered, and CloudWatch Events takes care of the rest.
For example, you can create a rule that triggers an action whenever an EC2 instance fails a health check. This action could be sending a notification to your operations team, rebooting the instance, or even invoking a Lambda function to perform automated remediation.
CloudWatch Events integrates seamlessly with other AWS services, allowing you to automate complex workflows and streamline your operations. You can easily integrate with services like AWS Lambda, AWS Step Functions, and AWS SNS to perform a wide range of automated actions.
By automating routine tasks and reducing manual intervention, CloudWatch Events helps you improve efficiency, reduce downtime, and ensure uninterrupted service for your customers.
Conclusion and Next Steps
In this guide, we have explored the various features and capabilities of Amazon CloudWatch. From monitoring resources and creating alarms to analyzing performance metrics and automating actions, CloudWatch offers businesses a comprehensive solution for monitoring and managing their AWS environment.
By harnessing the power of CloudWatch, businesses can gain full visibility into their AWS environment, allowing them to optimize their resource utilization, identify potential bottlenecks, and proactively detect and resolve issues. With its intuitive dashboard, customizable alarms, and rich analytics, CloudWatch empowers businesses to make data-driven decisions, ultimately driving efficiency and reducing costs.
To get started with Amazon CloudWatch, simply sign up for an AWS account and access the CloudWatch service through the AWS Management Console. From there, you can start setting up your monitoring and management setup, customize your dashboards, create alarms, and leverage the full potential of CloudWatch.